

Cut Response Delays: Live Chat Under 2 Minutes for Social Media Teams
Aim for under 2 minutes on live chat, 1 to 15 minutes on messaging apps, Typically between half an hour to an hour on Instagram DMs, 1 to 4 hours on public comments, and up to a full day for general backlog. A “first response” only counts if it moves the case forward, not an automated acknowledgment. Track median first response time, SLA adherence, response rate, and CSAT together, never speed alone.
TL;DR:
- Response times should match message urgency, with public complaints and purchase questions prioritized for faster replies within minutes, especially on high-visibility channels.
- Track multiple metrics including first response time, acknowledgment time, response rate, and CSAT, focusing on medians and the 90th percentile for a clear performance picture.
- Implement workflow improvements such as unified inbox routing, AI-assisted responses, and escalation triggers before expecting staff to type faster.
- Set channel-specific SLAs: under 2 minutes for live chat, 1 to 15 minutes for messaging apps, 30 to 60 minutes for DMs, and up to 4 hours for public comments.
- Conduct a data audit before launching changes, pilot for 4 to 8 weeks, and continuously review metrics to prevent speed regressions and align response times with customer expectations.
Table of Contents
- Why Social Media Response Time Benchmarks Vary So Widely
- Why Response Speed Actually Moves the Needle
- What Metrics Actually Tell You the Truth
- How to Actually Improve Your Response Times
- Setting SLAs by Channel
- Turning This Into an Actual Program
- The PHENYX Quick Summary
- Speed vs. Quality: Where the Real Trade-off Lives
- Let Phenyx Handle the Response-Time Overhaul
- Where This Data Comes From
- Sources
- FAQ
Why Social Media Response Time Benchmarks Vary So Widely
Search “average response time social media” and you’ll get answers ranging from minutes to a full day. That’s not sloppy research. It’s different studies measuring different things.
The Sprout Social Index finds that most consumers want a reply within 24 hours, but that number shifts fast depending on message type. A general product question can wait. A public complaint or a DM asking about a return cannot. Statista’s customer service data shows similar spread once you slice by platform and demographic, which explains why one report says “24 hours” and another says “under an hour” for what sounds like the same question.
Three variables drive most of the disagreement:
- Platform. Chat and DM tools imply real-time conversation; a comment thread does not.
- Message type. Complaints and purchase-intent questions carry urgency that a general mention doesn’t.
- Visibility. Public replies affect brand perception in front of an audience; private messages don’t carry that same reputational weight.
Pick your benchmark by matching it to your actual traffic. A brand fielding mostly DM-based support needs a tighter target than one handling public comment threads on evergreen content.
Why Response Speed Actually Moves the Needle
Speed isn’t a vanity metric. It’s tied directly to whether a customer sticks around.
The retention math: Sprout Social’s research on brand loyalty shows that customers who get fast, human replies are considerably more likely to stay loyal, while slow or absent responses push people toward competitors. Speed is a retention lever, not just a service courtesy.
Not every message deserves the same urgency, though. Triage matters more than blanket speed:
- Public complaints jump the queue first. They’re visible, and delay compounds the reputational damage.
- Purchase-intent questions (“does this ship to Texas?”) are effectively sales conversations happening in your mentions.
- VIP or high-follower accounts carry outsized visibility if ignored.
- General mentions and low-stakes tags can wait inside your standard SLA window.
Here’s the nuance most guides skip: customers still prefer a human on the other end, even when they’re fine with a bot handling triage. Automation buys you availability. It doesn’t replace the judgment a real reply requires when the stakes are high. Pair that with the reputational discipline covered in this step-by-step guide to online reputation management, and you start to see why speed and tone have to move together, not one at the expense of the other.
What Metrics Actually Tell You the Truth
Response time on social platforms isn’t one number. It’s a small family of metrics, and conflating them is the single most common measurement mistake teams make.
Sprout Social’s metrics guidance recommends tracking these together, not in isolation:
- First response time (FRT): how long until the first meaningful reply, not an automated ack.
- Acknowledgment time: how long until any response, bot or human, lands. Report this separately from FRT.
- Time to resolution: how long until the issue is actually closed.
- Response rate: what share of inbound messages get answered at all.
- Backlog: how many open tickets are sitting unanswered right now.
- Escalation rate: how often frontline replies get kicked upstairs.
- CSAT: whether the customer was actually satisfied with the interaction, not just how fast it happened.
Report the median, not just the average. A handful of extreme delays can distort a mean badly, which is why checking the 90th percentile alongside the median gives you a truer picture of your distribution.
| Metric | What it measures | Reporting tip |
|---|---|---|
| First response time | Time to a case-moving reply | Report median, segment by channel |
| Acknowledgment time | Time to any reply (bot or human) | Track separately from FRT |
| Time to resolution | Time to case closure | Segment by inquiry type |
| Response rate | Share of messages answered | Watch for silent drop-off |
| Escalation rate | Frequency of tier-2 handoffs | Flag training gaps |
A minimal dashboard needs four things visible at a glance: median FRT by channel, SLA adherence percentage, current backlog count, and rolling CSAT. Everything else is detail work. For a broader look at what belongs on a marketing dashboard, our guide on marketing dashboard metrics that actually drive decisions covers the same discipline applied more widely.
How to Actually Improve Your Response Times
Speed problems are usually workflow problems wearing a disguise. Fix the plumbing before you ask people to type faster.
- Unify your inbox and add routing rules. Collision detection (so two agents don’t answer the same DM), clear ownership, and priority labels for complaints or purchase questions cut wasted minutes immediately.
- Use AI-assisted suggested replies, not blanket automation. A suggested reply speeds up a human agent’s typing. A fully automated bot reply can feel like a response but isn’t case-moving unless it actually resolves something.
- Deploy chatbots for triage, with a hard handoff rule. Bots are excellent at routing and FAQ deflection. They’re bad at anything emotional, complex, or complaint-adjacent. Set a rule: after one failed resolution attempt, hand off to a human automatically.
- Build a template library with escalation triggers built in. Canned responses save time on repetitive questions, but they need a built-in trigger that flags anything outside their scope for a live agent.
- Stagger shifts around your actual peak hours. Most brands discover their traffic spikes don’t match their staffing schedule. Pull your hourly volume data before you build the roster.
Pro Tip: Run a two-week audit of your inbound message timestamps before changing anything. Most teams assume their peak hour is midday when it’s actually evening, right after people get off work and start scrolling.
Outsourcing overflow to a hybrid bot-and-human coverage model works well for brands that can’t staff 24/7 but still want sub-hour DM response. The mix matters more than the headcount.
Setting SLAs by Channel
Not every channel deserves the same clock. The Freshworks Benchmark Report shows that top-performing teams keep first response under 20 seconds on some messaging channels and resolve many queries in under four minutes, though performance swings widely between Facebook, WhatsApp, and Instagram.
A workable SLA tier structure looks like the following:
- Live chat: under 2 minutes, always. Customers on chat expect a conversation, not a queue.
- Messaging apps (WhatsApp, Messenger): 1 to 15 minutes during business hours.
- Instagram/X DMs: between 30 and 60 minutes.
- Public comments and mentions: 1 to 4 hours, tighter if the comment is a complaint.
- Low-priority tags and general mentions: within 24 hours.
Automation should fill the gap during off-hours, not replace human coverage during peak business hours. If you’re not staffed 24/7, be honest about it in your bio or auto-reply rather than letting silence do the talking.
Turning This Into an Actual Program
Benchmarks are useless without a rollout plan. Here’s a sequence that works for most teams:
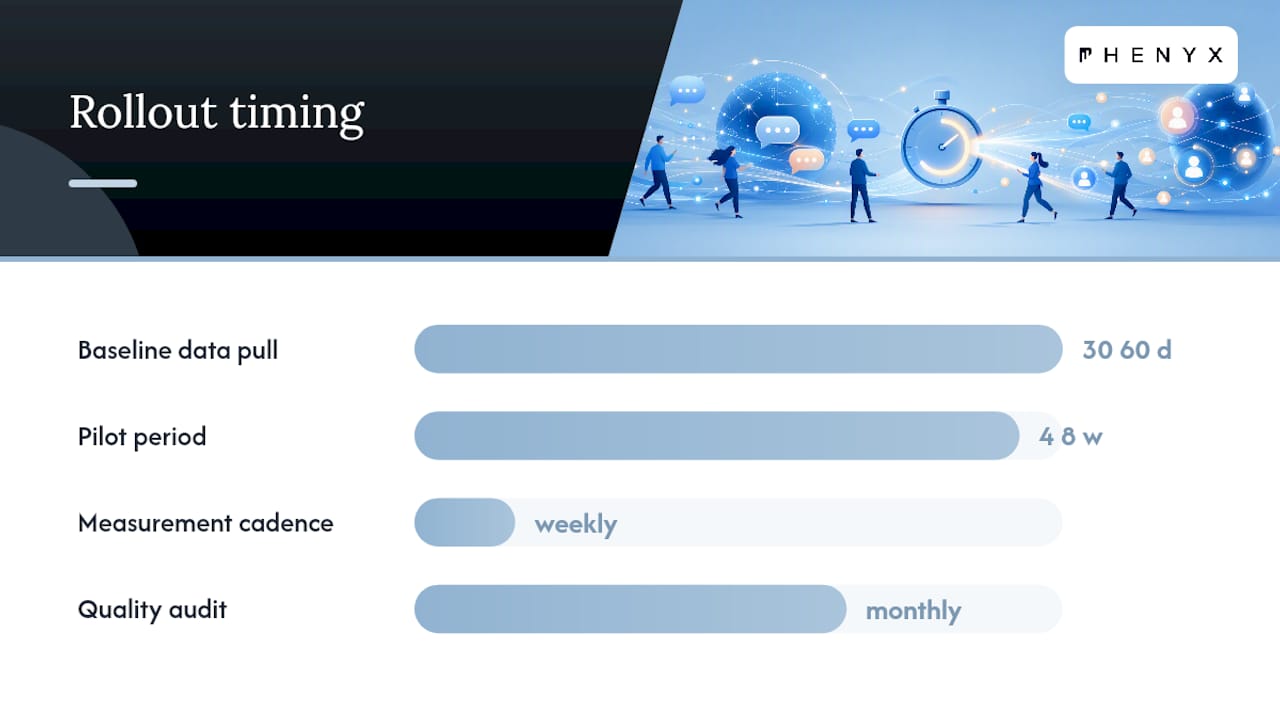
- Audit your current data. Pull 30 to 60 days of timestamps before setting any target. You need a baseline, not a guess.
- Set SLA tiers by channel using the bands above, adjusted for your own traffic patterns.
- Redesign the workflow around routing rules and ownership, not individual heroics.
- Roll out templates and automation with clear handoff triggers.
- Pilot for 4 to 8 weeks. Measure median FRT, SLA adherence, CSAT, and backlog reduction weekly, not just at the end.
Pro Tip: Look at your 90th percentile, not just your median, when the pilot ends. A great median hiding a handful of 12-hour outliers means your routing rules have a blind spot, usually around off-hours or a specific inquiry category.
Governance is what keeps a pilot from decaying back into old habits. Set escalation rules in writing, run a monthly quality audit on a sample of closed tickets, schedule recurring training for new hires, and report the core metrics on a fixed cadence, weekly at minimum. Skipping the governance step is why most speed initiatives fade within a quarter.
The PHENYX Quick Summary
Here’s the short version if you’re skimming for the next meeting:
- Target under 2 minutes for live chat, 1 to 15 minutes for messaging apps, 30 to 60 minutes for DMs, and 24 hours as your outer ceiling.
- Separate acknowledgment time from first response time. Bots ack; humans respond.
- Track median, not just average, and check your 90th percentile for hidden delays.
- Triage complaints and purchase-intent messages ahead of general mentions.
- Fix routing and ownership before you ask staff to work faster.
- Pilot changes for 4 to 8 weeks and measure weekly, not just at the finish line.
Phenyx approaches this the same way it approaches any operational marketing problem: audit the current workflow, identify where messages stall, rebuild routing and templates around actual traffic patterns, then measure against the new baseline on a regular cadence. The specific sequencing is tailored per client, but the structure behind it stays consistent.
Speed vs. Quality: Where the Real Trade-off Lives
The instinct to chase a universal fast number is understandable and usually wrong. Pre-sale questions and high-visibility complaints deserve near-immediate attention because delay there costs you a sale or a reputation hit in public view. A nuanced billing dispute or a sensitive complaint deserves a slower, more careful reply, because a fast but wrong answer does more damage than a slightly delayed correct one.
Treat your SLA bands as a hypothesis, not a permanent rule. Test them, watch CSAT alongside speed, and adjust quarterly rather than setting a number once and walking away.
— PHENYX
Let Phenyx Handle the Response-Time Overhaul
Rebuilding routing rules, training templates, and reporting dashboards takes real hours most in-house teams don’t have lying around between everything else on their plate. Phenyx runs this as one coordinated project instead of scattering it across four different vendors and hoping the pieces line up.
Because design, content, and marketing operations are kept under one in-house team, your social response workflow can be integrated with your broader brand and web presence instead of managed separately. This approach can reduce handoffs, improve turnaround times, and provide a single point of contact rather than multiple account managers. If your team needs ongoing support across social operations, reporting, and the rest of your marketing stack, the MODS subscription starts at $4,000 per month and covers exactly this kind of continuous, measured work. Schedule a conversation with Phenyx to map your current response gaps and see where a structured workflow would save the most time.
Where This Data Comes From
The benchmarks above draw from a handful of primary sources worth bookmarking. Sprout Social’s first response time guide breaks down channel-by-channel targets and measurement pitfalls. The Sprout Social Index surveys consumer expectations directly. The Freshworks Benchmark Report supplies channel performance data, and Statista tracks broader customer service trends over time.
Sources
FAQ
What Is a Good Social Media Response Time?
Under 2 minutes for live chat, 1 to 15 minutes for messaging apps, 30 to 60 minutes for Instagram DMs, and up to 24 hours for general public comments is a workable target range across most industries, according to Sprout Social. Adjust tighter for complaints and purchase-intent messages.
What Is the 5:3:2 Rule for Social Media Posts?
The 5:3:2 rule is a content mix guideline, not a response-time rule: five pieces of curated or third-party content, three original brand posts, and two personal or promotional posts out of every ten. It applies to publishing strategy, not customer service speed.
What Is the 70/20/10 Rule for Social Media?
Like the 5:3:2 rule, it governs what you post, not how fast you reply to inbound messages.
Is There a “5-3-1” or “5-5-5” Rule for Social Media Response Times?
There’s no established, sourced version of a “5-3-1” or “5-5-5” rule specific to response times. Definitions circulating online vary and aren’t backed by a consistent industry standard, so treat any version you find with caution and rely on channel-based SLA bands instead.
How Do You Measure First Response Time Correctly?
First response time should count only a reply capable of progressing the customer’s issue, not an automated acknowledgment. Sprout Social recommends tracking acknowledgment time and first response time as two separate metrics, and reporting the median rather than the average to avoid distortion from outlier delays.