

Every 100ms Costs Conversions: Site Speed Wins for Small Businesses
Faster pages convert more visitors, and the gap is not small. Shopify’s 2026 analysis found that every 100 milliseconds of added load time tends to lower conversion rates noticeably, and stores loading in 2.5 seconds converted significantly worse than those loading in 1.5 seconds. Speed is one lever among several including product, offer, and funnel design, so start by checking your Largest Contentful Paint and your session key event rate this week.
TL;DR:
- Improving load times from 2.5 seconds to under 1.5 seconds can significantly boost conversions, especially for young or scaling stores.
- Fixing image sizes, implementing caching and CDN, and deferring unnecessary scripts are the most effective speed optimizations with quick implementation timelines.
- Monitoring GA4 session key event rates and real-user data provides the most reliable indicators of speed fix impact on conversions.
- Prioritizing Largest Contentful Paint and Interaction to Next Paint is crucial since these metrics directly influence user experience and shopping behavior.
- Large projects like server migrations or replatforming can take weeks but are often necessary for sustained speed improvements and higher revenue.
Table of Contents
- Quick Summary
- What the Data Says About Speed and Conversions
- Core Web Vitals: What to Measure First
- Tools and Measurement: From Lab Data to GA4
- Fixes That Move Conversion Metrics
- Proving the Business Impact After You Ship Fixes
- What Speed Fixes Typically Cost and Take
- Where We’d Invest First
- How PHENYX Helps You Turn Speed Into Sales
- Sources
- FAQ
Quick Summary
- Target LCP of 2.5 seconds or faster, INP under 200 milliseconds, and CLS below 0.1, as Web recommends.
- This week, compress and resize images, put a CDN in front of your assets, and defer any third-party script that is not essential to the first screen.
- Confirm impact fast by watching your GA4 session key event rate alongside real-user monitoring data, not just lab scores.
- Expect Chrome User Experience Report field data to lag about 28 days behind a fix, according to Shopify’s findings.
- If your PageSpeed Insights score is “poor” on mobile and you cannot pinpoint the cause, that is the moment to bring in an agency for a prioritized audit.
What the Data Says About Speed and Conversions
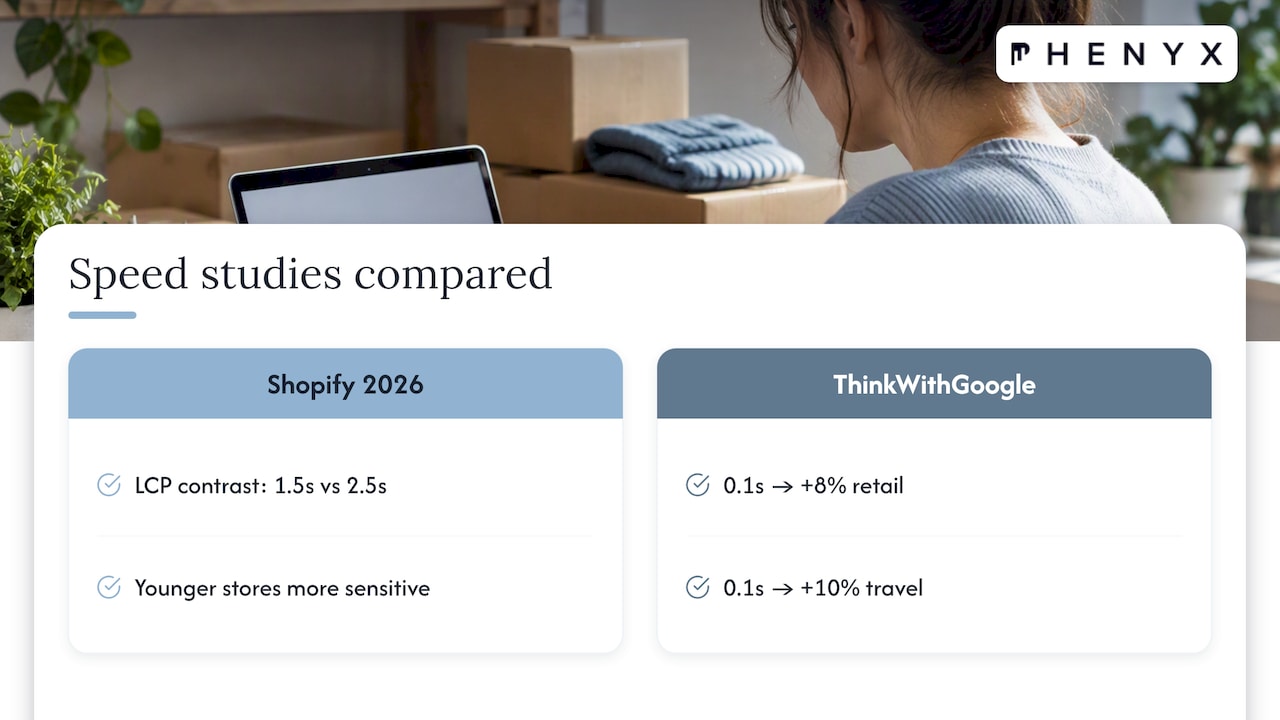
The clearest evidence comes from two large studies with different methods that land on the same conclusion. Shopify’s 2026 review of store performance tied Largest Contentful Paint and Interaction to Next Paint directly to checkout completion, finding that stores with a 2.5 second LCP converted substantially worse than stores hitting 1.5 seconds. Separately, ThinkWithGoogle’s “Milliseconds Make Millions” report found that shaving just 0.1 seconds off mobile load time correlated with an average 8% conversion increase for retail sites and 10% for travel sites in its sample.
Correlation is not the same as causation, and Shopify’s own analysis notes that store maturity changes the picture. Growing and newer stores tend to be more sensitive to load-time swings than established brands, so a startup fixing its LCP may see a sharper percentage lift than a mature retailer, even though the mature site’s absolute revenue gain could be larger. The practical read for small businesses: if you are scaling traffic or running paid campaigns into a young site, speed work pays off faster and more visibly than it will once you have years of brand trust cushioning your conversion rate.
Core Web Vitals: What to Measure First
Google’s Core Web Vitals give you three numbers that map closely to what a visitor actually experiences. Largest Contentful Paint measures how long the main content takes to appear, and web.dev’s threshold research sets “good” at 2.5 seconds or under. Interaction to Next Paint measures how quickly the page responds when someone taps or clicks, with 200 milliseconds as the good threshold. Cumulative Layout Shift tracks visual stability, and anything under 0.1 counts as good.
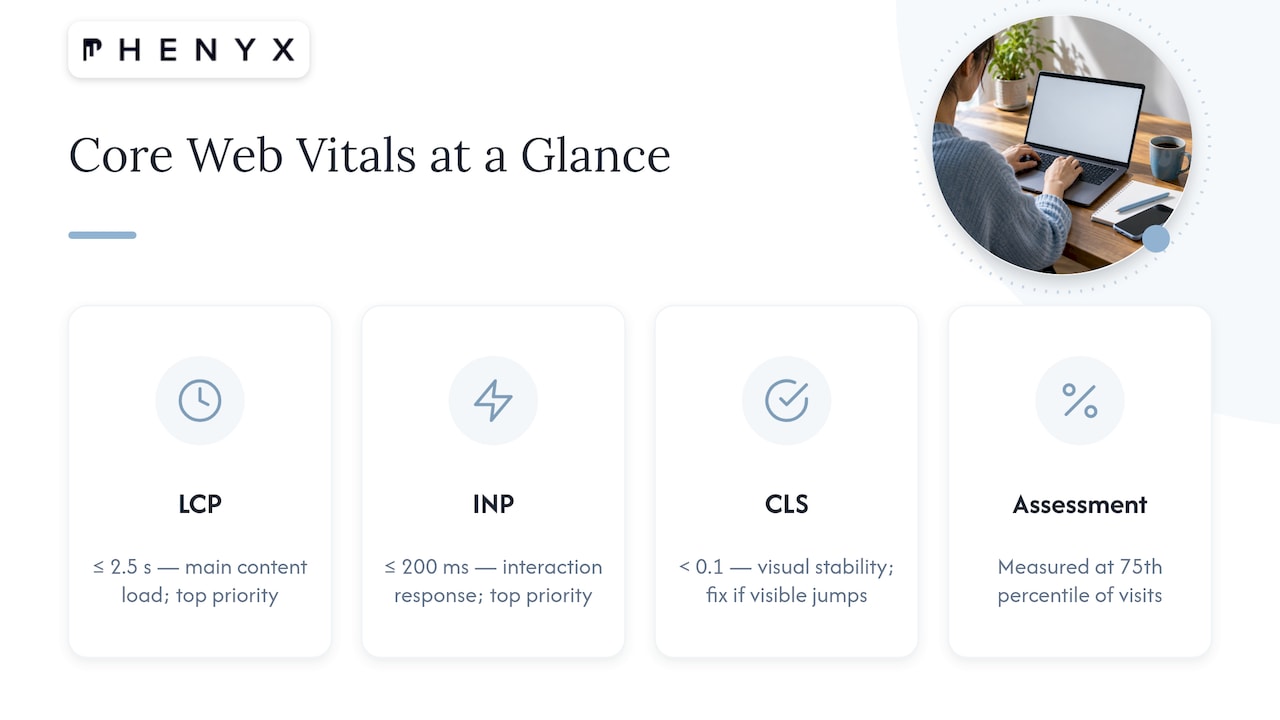
Google assesses these at the 75th percentile of real visits, meaning three out of four sessions need to meet the threshold before a page is labeled “good,” which is a higher bar than passing an average score. For conversion work, prioritize LCP and INP first since they track load and responsiveness, the two things a frustrated shopper actually feels. Fix CLS when it is causing visible jumps, like a button shifting as a shopper tries to click it, but do not spend your best hours chasing marginal CLS gains before your load time is under control.
Tools and Measurement: From Lab Data to GA4
Start with PageSpeed Insights, which combines Lighthouse lab data with real Chrome User Experience Report field data and reports both lab diagnostics and 75th-percentile field results. Lab data is useful for debugging specific problems, while field data reflects what actual visitors experienced, and CrUX aggregates that field data on a rolling 28-day window, so a fix you shipped last week will not show up there yet.
- Run PageSpeed Insights on your top landing and product pages, not just your homepage.
- Add a real-user monitoring script or the open-source web-vitals library to catch performance issues sooner than CrUX will.
- In GA4, track session key event rate, the share of sessions containing a conversion event, to judge landing-page and campaign impact right after a change, as Analytics Mania explains.
- Where traffic allows, roll fixes out in phases or to a subset of pages so you can compare before-and-after cleanly.
Fixes That Move Conversion Metrics
Not every speed fix earns the same return, so work through this list roughly in order.
- Optimize images first. Use responsive
srcsetmarkup, modern formats like WebP or AVIF, and compress hero images to sensible file sizes; this is usually the single biggest lever on retail and portfolio sites. - Add caching and a CDN. Set proper cache headers and serve static assets through an edge CDN to cut Time to First Byte, especially for visitors far from your server.
- Unblock rendering. Inline the critical CSS needed for the first screen and defer any JavaScript that is not required immediately.
- Lazy-load what is out of view. Defer offscreen images, embedded video, and user-generated content until a visitor scrolls or interacts with that section.
- Audit third-party scripts. Load tracking pixels and chat widgets asynchronously, and remove any tag your team cannot justify keeping.
- Watch your platform’s app bloat. Ecommerce platforms in particular slow down fast once several heavy apps are stacked on a theme, so review what is actually earning its keep.
Marketers without developer access still have levers: compress every image before uploading it, cap hero image file sizes, and periodically audit your tag manager for scripts nobody remembers adding.
Pro Tip: Before adding any new app, plugin, or tracking tag, ask whether it is worth the milliseconds it will cost on every single page load.
Proving the Business Impact After You Ship Fixes
Pick your primary KPI before you start, whether that is session key event rate, revenue per session, or conversion rate on a specific landing page, and stick with it through the whole test. Segment results by device, campaign source, and landing page, since mobile checkout and product pages often carry the heaviest scripts and show the sharpest swings when fixed.
Where traffic volume supports it, run a phased rollout or an A/B test so you can attribute the change to speed rather than to a seasonal spike or a new ad campaign. Where you cannot split traffic cleanly, compare a holdout group of pages against the pages you improved. Lean on GA4 and real-user monitoring for near-term reads, since CrUX field data updates slowly and will not confirm your win for weeks.
What Speed Fixes Typically Cost and Take
Quick wins like image compression and cache header changes usually take hours to a few days and cost little beyond the time spent. Medium projects, such as deferring render-blocking scripts or setting up a CDN, typically run one to four weeks and carry moderate cost depending on how much custom theme code needs rework. Bigger jobs, like a server migration or a full replatform, can stretch across multiple weeks or months and carry the highest price tag. For most small businesses, a scoped audit or a managed engagement is the more cost-effective way to sequence this work correctly the first time.
Where We’d Invest First
Fix what you can measure. Chasing a perfect Lighthouse score without tying it to a KPI wastes budget. We prioritize LCP and INP fixes first because they show up fastest in GA4, and we have seen well-targeted server and caching work cut Time to First Byte meaningfully on client sites.
— PHENYX
How PHENYX Helps You Turn Speed Into Sales
Most small business teams do not have the bandwidth to diagnose a slow site, fix it correctly, and then prove the fix worked in their analytics, and that gap is exactly where a scoped engagement pays for itself. PHENYX runs speed audits that end in a prioritized action plan, not just a scorecard, and we set up GA4 tracking so you can see the conversion impact of each fix rather than guessing at it.
- Get a site speed and conversion audit that ranks fixes by impact and effort.
- Have our team implement the highest-value technical fixes, from image pipelines to CDN setup.
- Roll speed work into an ongoing MODS engagement alongside your website design and SEO work.
If you want a second set of eyes on where your site is losing shoppers, request a scope and we will tell you exactly what to fix first.
Sources
For deeper detail, see Shopify’s 2026 store speed analysis, ThinkWithGoogle’s millisecond study, Google’s PageSpeed Insights documentation, and this explainer on faster sites and conversions.
- Milliseconds make Millions — Think With Google
- About PageSpeed Insights | Google for Developers
- Conversion rate in Google Analytics 4 (2026) - Analytics Mania
- Web
FAQ
Is 12% conversion rate on a website good?
Compare your rate against your own historical baseline and your GA4 session key event rate rather than a single industry number.
What is a good site conversion rate?
There is no single universal benchmark, since a “good” rate varies by industry, traffic quality, and whether you are measuring purchases, leads, or sign-ups. The more useful practice is tracking your own session key event rate over time and after specific changes, like the speed fixes covered above.
How do I measure my website’s speed?
Run your key pages through PageSpeed Insights to see both lab diagnostics and real-user field data for LCP, INP, and CLS. Pair that with real-user monitoring or the web-vitals library so you get faster feedback than the 28-day CrUX aggregation window allows.
Is a 6% conversion rate good?
Track it against your own trend line and segment by landing page and device to see where it is strongest and weakest.
How fast should a website load for the best conversions?
Aim for a Largest Contentful Paint of 2.5 seconds or faster, since web.dev’s threshold research and Shopify’s analysis both link that mark to meaningfully higher conversion than slower pages. Every 100 milliseconds beyond that point tends to cost you conversion, so faster is consistently better within reason.