

CRO Basics for Business Owners: Fix UX, Test This Month
Conversion rate optimization (CRO) is the process of increasing the percentage of visitors who take a desired action on your site, whether that’s a purchase, a form submission, or a newsletter sign-up. As a beginner, you can run a focused six-step program to reduce friction and lift conversions without spending another dollar on traffic. The wins come from clarity, not volume.
TL;DR:
- Track one primary business outcome alongside two or three smaller funnel actions; strong intermediate activity with weak purchases often points to payment or shipping friction.
- Baymard research estimates fixing checkout problems can raise large ecommerce sites’ conversion rates by up to 35%; disclose total costs early and simplify forms.
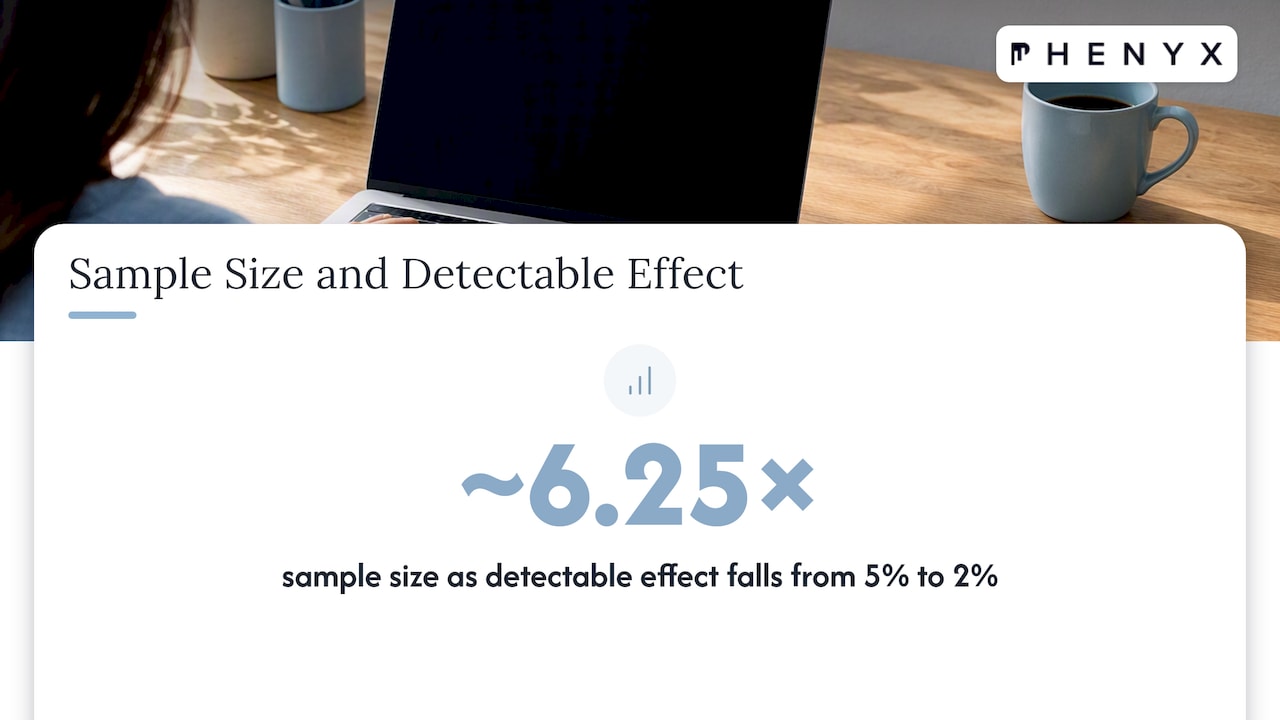
- Estimate sample size and success criteria before testing; reducing the detectable effect from 5% to 2% requires roughly 6.25 times as many visitors.
- If traffic cannot support a reliable test within weeks, use session recordings or moderated usability sessions instead of running an inconclusive experiment for months.
- Start with quick fixes in the first two weeks, review analytics by week eight, and seek outside help in weeks nine to twelve if needed.
Table of Contents
- Quick Summary: The Fast Path to Better Conversions
- What Is Conversion Rate Optimization, Exactly?
- Why CRO Matters More Than Chasing More Traffic
- Core Principles Every Beginner Should Know
- A Six-Step CRO Workflow You Can Run This Month
- Which Website Elements Should You Audit First?
- Metrics and Tools You Actually Need as a Beginner
- Why Testing Discipline Matters More Than Clever Ideas
- Your 90-Day CRO Action Checklist
- What Hands-On CRO Work Actually Looks Like
- What Beginners Usually Get Wrong About Timelines
- How We Can Help You Put This Into Practice
- FAQ
- Sources
Quick Summary: The Fast Path to Better Conversions
Before we walk through the details, here’s the shape of a sound CRO program:
- Set one primary conversion goal and the metric that tracks it.
- Run a quick funnel analysis to find where visitors drop off.
- Fix high-friction UX issues first: forms, checkout, page speed.
- Turn observations into hypotheses, then test them under controlled conditions.
- Measure results against a single Overall Evaluation Criterion (OEC) plus guardrail metrics.
- Document what works and repeat the cycle on the next biggest friction point.
- Bring in outside help once testing volume or technical complexity outpaces your team.
Each of these gets its own section below, with the reasoning and the research behind it.
What Is Conversion Rate Optimization, Exactly?
A conversion is any action you want a visitor to complete: buying a product, booking a call, downloading a guide, or signing up for an email list. Conversion rate is simply the percentage of visitors who complete that action, calculated as (conversions divided by total visitors) multiplied by 100. If 2,500 people visit your product page in a month and 75 complete a purchase, your conversion rate is 3%.
Not every conversion carries the same weight. Macro conversions are the primary business outcomes: a completed sale, a signed contract, a qualified lead form. Micro conversions are the smaller steps that lead there, like adding an item to a cart, starting a checkout, or watching a product video. Tracking only macro conversions can hide where visitors actually get stuck, while tracking only micro conversions can make a page look healthy even when it never produces revenue.
For beginners, the practical lesson is this: pick the macro conversion that matters to your business first, then map two or three micro conversions that lead to it. That combination tells you not just whether people convert, but where they fall out of the process. A checkout funnel with strong micro conversions but a weak macro conversion rate usually points to a specific, fixable problem late in the process, often at payment or shipping information. Getting this mapping right before you start testing saves weeks of chasing the wrong fix.
Why CRO Matters More Than Chasing More Traffic
Buying more traffic is expensive and the returns shrink as competition for keywords and ad placements increases. Improving the conversion rate on the traffic you already have is often the cheaper lever, because it multiplies the value of every visitor you’re already paying to attract.
The upside can be substantial. Baymard Institute research finds that large e-commerce sites can gain up to 35% in conversion rate by fixing common checkout usability problems, and the same research shows that 64% of desktop sites and 63% of mobile sites currently have mediocre or worse checkout performance. That means most sites are leaving a measurable amount of revenue on the table through fixable issues: unclear total costs, confusing shipping options, and overly long forms.
The business outcomes tend to show up in a few predictable places. A SaaS company that simplifies its sign-up form sees more trial activations from the same ad spend. A local service business that clarifies its call-to-action sees more phone calls from the same number of page visits. A retailer that shows total cost earlier in checkout sees fewer abandoned carts at the same traffic level. None of these require a bigger marketing budget. They require fixing what’s already broken in the experience you’re sending people through.
Core Principles Every Beginner Should Know
Before running your first test, it helps to internalize a few rules that separate reliable CRO programs from guesswork dressed up as strategy.
- Prioritize friction your customers actually experience over cosmetic “best practices” borrowed from other industries.
- Define a single Overall Evaluation Criterion (OEC) for each test, along with guardrail metrics that catch unintended harm.
- Build every test around a specific hypothesis, not a hunch from the highest-paid person’s opinion.
- Design tests with enough statistical power before you launch, and decide your success criteria in advance.
Practitioner guidance from experimentation research describes this directly: define your OEC and sample size requirements ahead of time, and let controlled experiments tell you what customers actually do rather than relying on internal opinion, sometimes called a HiPPO decision (the highest-paid person’s opinion). This matters because a test optimized for the wrong metric can “win” on a vanity number while quietly hurting revenue, refund rates, or customer satisfaction elsewhere.
Pro Tip: Narrow your OEC to a specific user segment, like only visitors who start checkout, rather than your entire site traffic. This lowers the sample size you need to reach statistical confidence and lets you learn faster.
These principles aren’t academic. They’re the difference between a testing program that compounds real gains over a year and one that produces a string of false positives that never show up in revenue.
A Six-Step CRO Workflow You Can Run This Month
Here’s the ordered process we’d recommend to anyone starting from zero:
- Set a clear conversion goal and baseline metric. Decide what the primary action is (purchase, lead, sign-up) and pull your current conversion rate for that action over the last 30 to 90 days.
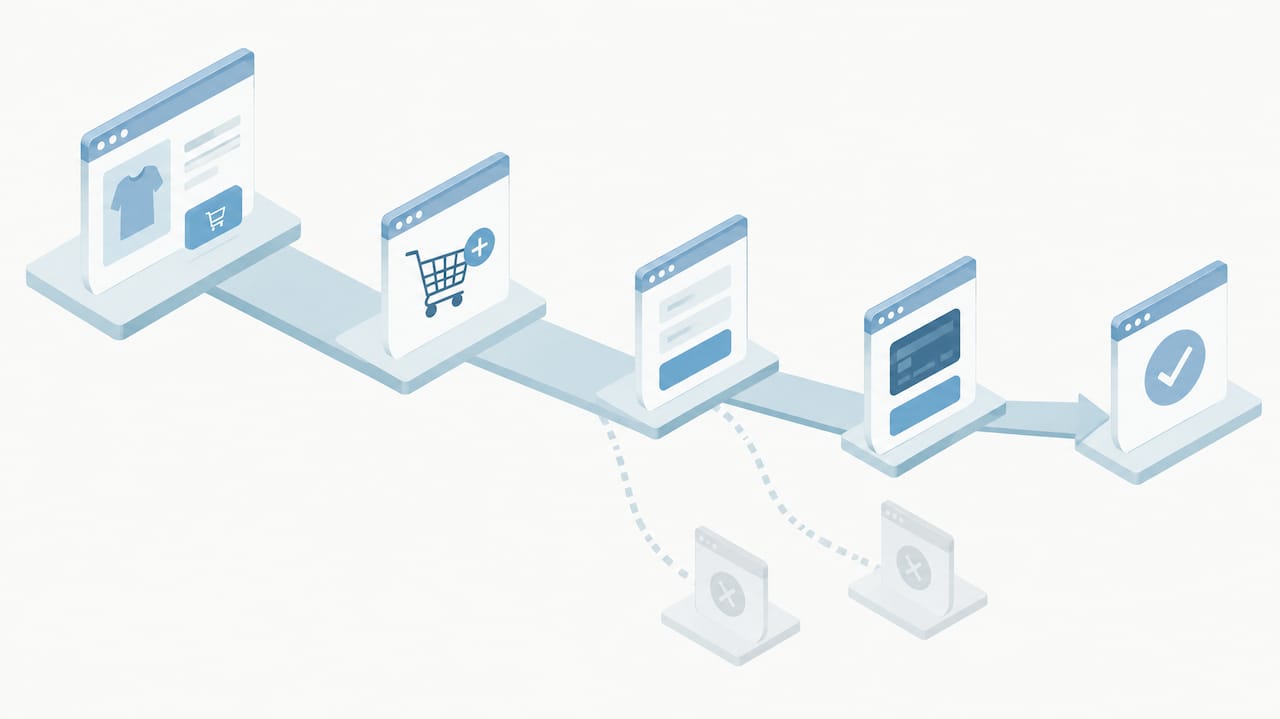
- Find your biggest drop-off points. Use your analytics funnel reports to see where visitors leave the process. A checkout funnel that loses 40% of visitors at the shipping step tells you exactly where to focus first.
- Gather qualitative evidence. Session recordings and short on-site surveys reveal why people are stalling, not just where. A visitor who hesitates on a form field might be confused about whether it’s required.
- Turn observations into prioritized hypotheses. Rank your ideas by expected impact and ease of implementation. A one-line form label change is easier to ship than a full checkout redesign, even if the redesign might matter more.
- Estimate sample size, then run the test. Before launching, calculate how many visitors you’ll need to detect a meaningful difference. Underpowered tests produce noise, not answers, which we cover in more detail below.
- Implement the winner and track your OEC over time. A test that wins once should keep producing results after it ships. If the lift disappears after a few weeks, something else likely changed and the result deserves a second look.
This cycle works whether you’re optimizing an e-commerce checkout, a service lead form, or a SaaS trial sign-up. The sequence matters: skipping step 3 (qualitative evidence) and jumping straight to testing is the most common beginner mistake, because it leads to testing changes that look reasonable but don’t address the actual source of friction. Skipping step 5 (sample size estimation) is the second most common, and it’s the one that quietly wastes the most time, since a test that never reaches statistical power can run for months without producing a trustworthy answer either way.
If you’re driving traffic through paid campaigns, this workflow pairs naturally with conversion rate optimization tips, since a mismatch between ad messaging and landing page content is one of the most common reasons step 2 shows high drop-off on paid traffic specifically.
Which Website Elements Should You Audit First?
Some areas of a website produce outsized conversion gains when fixed, while others are mostly cosmetic. Start with these:
- Landing page messaging: align the headline and offer with whatever ad, email, or search result brought the visitor there, since a mismatch creates instant doubt.
- Calls-to-action: make the button language specific and visually distinct from the rest of the page (“Get Your Free Quote” outperforms a generic “Submit” in most contexts).
- Forms: cut every field that isn’t necessary for the next step, and label required versus optional fields clearly rather than assuming visitors will guess.
- Checkout cost transparency: show total cost, including shipping and tax, as early as possible rather than surprising shoppers at the final step.
- Page speed and mobile usability: a slow-loading page or a form that’s awkward to fill out on a phone loses visitors before they ever see your offer.
On checkout specifically, Baymard’s research consistently identifies the same small set of fixes as high priority across most e-commerce sites: show total order cost early, simplify form fields, and mark required and optional fields clearly, since mobile checkout carries extra friction from on-screen keyboards and cramped field layouts. If you sell physical products, these three fixes alone are usually worth testing before anything else on your list.
For lead-generation sites, the equivalent friction points are different but just as fixable: confusing navigation that buries your contact form, a phone number that’s hard to find on mobile, or a form that asks for information visitors don’t want to give up before a first conversation. We’ve seen these exact issues show up repeatedly in reviews of underperforming lead-generation websites, where a short, plainly labeled form often outperforms a longer “qualification” form that feels like a hurdle.
Structural fixes like these tend to outperform purely visual changes, like swapping button colors or testing different fonts. A visually polished page that still asks for too much information or hides the total cost until the last step will usually underperform a plainer page that removes those barriers.
Metrics and Tools You Actually Need as a Beginner
Conversion rate itself is calculated as total conversions divided by total visitors, multiplied by 100. The harder decision is choosing your OEC, the single metric that defines success for a given test. For an e-commerce checkout test, that’s often completed purchases. For a lead-generation form, it might be qualified form submissions rather than raw submissions, since a spike in low-quality leads isn’t really a win.
Alongside your OEC, track one or two guardrail metrics that would flag a problem even if the OEC improves. A checkout change that boosts completed purchases but also spikes refund requests isn’t actually a win. Keep the distinction between primary metrics (what you’re optimizing for) and proxy metrics (early signals that correlate with, but don’t guarantee, the outcome you want) clear in every test plan.
Basic tracking setup matters more than most beginners expect. If you’re running paid campaigns, setting up proper conversion tracking lets you see which traffic sources actually produce conversions rather than just clicks. One caution worth building into your setup from day one: if your business touches health information in any way, FTC and HHS guidance warns against sending protected health information to third-party analytics tools without proper safeguards, so audit your tracking flows before adding new pixels or scripts.
For tool categories, beginners generally need four things: a web analytics platform for funnel and traffic data, a session-recording or heatmap tool to see how visitors actually interact with pages, an A/B testing platform to run controlled experiments, and a page-speed testing tool to catch technical drag before it costs you conversions. You don’t need every tool in every category on day one. Start with analytics and session recordings, since they’re the fastest way to generate your first round of hypotheses.
Why Testing Discipline Matters More Than Clever Ideas
One of the most useful things a beginner can learn early is healthy skepticism toward conversion “best practices” that circulate without solid evidence behind them.
A large-scale replication effort tested eight widely cited UI pattern changes, like rounded buttons and sticky calls-to-action, using a median of 2.4 million users per experiment at 80% statistical power, and found that only two of the eight produced a significant effect in the expected direction. That’s a meaningful gap between industry lore and what holds up under rigorous testing, and it’s a reason to treat generic “proven” tactics with caution until you’ve verified them on your own traffic.
The practical takeaway is about sample size. As the detectable effect size shrinks, the number of visitors you need to reach confidence grows fast. Research on controlled experiments shows that reducing your minimum detectable effect from 5% to 2% multiplies your required sample size by roughly 6.25 times, which means that detecting small revenue changes reliably often requires traffic volumes far beyond what a small or midsize site generates in a reasonable timeframe.
This doesn’t mean testing is pointless for smaller sites. It means matching your method to your traffic. If your site doesn’t get enough visitors to reach statistical power within a few weeks, qualitative research, like session recordings or short moderated usability sessions, often delivers faster, more actionable insight than an underpowered A/B test that runs for months without a clear answer.
A few habits protect you from fooling yourself with test results. Predefine your analysis plan and sample size before launching, rather than deciding what counts as a win after you see early numbers. Avoid “peeking” at results daily and stopping a test the moment it looks favorable, since early fluctuations often reverse. And resist running multiple unplanned comparisons on the same data set looking for something significant, since that approach tends to surface noise rather than real effects.
Your 90-Day CRO Action Checklist
Here’s how to sequence this work over the next three months, grouped by effort level:
- Days 1 to 14 (quick wins): fix CTA wording and visibility, label form fields as required or optional, show total cost earlier in checkout, and run basic page-speed fixes like image compression.
- Weeks 3 to 8 (medium effort): set up or clean up funnel analytics, review session recordings for your top three pages by traffic, and launch your first properly powered A/B test on the biggest friction point you found.
- Weeks 9 to 12 (escalation point): if test volume, technical complexity, or results tracking is outpacing your team’s bandwidth, this is the natural point to bring in outside help.
| Phase | Timeframe | Example actions |
|---|---|---|
| Quick wins | Days 1 to 14 | CTA clarity, form field labels, total cost visibility, speed fixes |
| Medium effort | Weeks 3 to 8 | Funnel analytics setup, session recording review, first A/B test |
| Escalation | Weeks 9 to 12 | Agency engagement for technical tracking, design, and testing capacity |
When you reach the escalation point, a reasonable agency partner should ask for access to your analytics, a clear view of your current funnel, and your existing brand and design assets before proposing changes. If a provider skips straight to recommendations without reviewing your actual data, that’s worth questioning.
What Hands-On CRO Work Actually Looks Like
Running a disciplined CRO program takes consistent attention: tracking setup, qualitative review, test design, and design implementation all pulling in the same direction. We built our in-house team around that reality, handling web design, tracking, and testing under one roof so a conversion fix doesn’t get stuck waiting on three separate vendors to coordinate.
In practice, that means when we find a checkout or form issue during an engagement, the same team that diagnosed it can redesign the page and verify the fix, rather than handing off a list of recommendations and hoping someone else implements them correctly. We follow a structured process for identifying friction and prioritizing fixes, similar to the funnel-and-hypothesis approach outlined above, adapted to each client’s traffic and goals rather than applied as a rigid template.
If you’re a business owner considering outside help, come prepared with access to your analytics platform, a rough sense of your current conversion rate, and examples of pages where you suspect visitors are dropping off. That context lets any agency, ours included, skip the guesswork phase and get straight to diagnosis. Our posts on conversion tracking setup and fixing underperforming lead-generation sites cover two of the most common starting points we see across client engagements.
What Beginners Usually Get Wrong About Timelines
The biggest misconception in beginner CRO is expecting fast, dramatic results from a single test. Realistic timing depends heavily on your traffic. A site with tens of thousands of monthly visitors might reach statistical confidence on a meaningful test within a few weeks. A site with a few hundred visitors a month may need months, which is exactly why qualitative research matters so much for smaller businesses.
The real value of CRO comes from compounding small, verified wins rather than chasing one transformational change.
The most common mistakes we’d flag for beginners: running tests without enough traffic to reach power, rolling out “winning” changes before a test finishes, and overlooking privacy obligations when adding new tracking scripts. Each one is avoidable with a bit of planning upfront.
— PHENYX
How We Can Help You Put This Into Practice
Reading about CRO is one thing. Finding the time to audit your funnel, fix your forms, and run properly powered tests on top of running your business is another. We handle that work directly, combining website design, conversion tracking setup, and ongoing optimization under one in-house team instead of routing you through separate vendors for each piece.
A discovery call with us typically covers your current analytics setup, a quick look at where visitors seem to be dropping off, and a realistic view of what a first round of fixes could look like for your site. For businesses that want ongoing support rather than a one-time project, our MODS plan bundles marketing execution, including conversion work, into a single monthly engagement starting at $4,000 per month. If you’re ready to see what that could look like for your site, reach out through Phenyx to set up a call.
FAQ
What is the basic idea behind conversion rate optimization?
Conversion rate optimization is the practice of increasing the percentage of website visitors who complete a desired action, like a purchase or form submission, without needing more traffic. It works by identifying friction points in your funnel, forming hypotheses about fixes, and testing those fixes under controlled conditions before rolling them out.
What are the main steps in a conversion optimization process?
A typical process includes setting a clear goal and baseline metric, analyzing your funnel to find drop-off points, gathering qualitative data to understand why visitors stall, and running controlled tests to validate fixes. Many practitioners group these into research, hypothesis, testing, and implementation phases, following the kind of structured approach described in controlled experimentation guides.
How do I start improving my website’s conversion rate?
Start by picking one primary conversion goal and calculating your current conversion rate for it, then use analytics and session recordings to find your biggest drop-off point. From there, form a specific hypothesis about the cause, estimate how much traffic you’ll need to test it reliably, and run the test before rolling out any change sitewide.
What are the typical stages in a CRO workflow?
Most CRO programs move through research (finding friction points through data and user feedback), hypothesis and testing (forming specific, testable ideas and validating them), and implementation (rolling out and monitoring verified winners). Baymard Institute’s checkout research is a useful reference for the research stage specifically, since it documents common friction points across large e-commerce sites.
How long should a conversion rate test run?
The right duration depends on your traffic volume and how large an effect you’re trying to detect, since smaller effects require larger sample sizes to confirm reliably. If your site doesn’t get enough visitors to reach statistical power within a reasonable window, qualitative research methods like session recordings often provide faster, more reliable direction than an underpowered test.
Sources
- Current state of checkout UX — Baymard Institute
- Trustworthy A/B Patterns and the Winner’s Curse: Lessons from Eight Large-Scale Replications
- Practical Guide to Controlled Experiments on the Web — Ron Kohavi et al.