

Track Marketing ROI Fast: 6 Steps to Wire Reliable ROMI for Marketers
We track marketing ROI by calculating net marketing contribution: incremental revenue multiplied by gross margin, minus marketing cost, divided by that cost. Getting a trustworthy number means instrumenting three things well: conversions, an attribution approach that fits your data maturity, and realistic customer lifetime value assumptions. Skip any one of those and the resulting ROI figure tells a story that doesn’t hold up under scrutiny.
TL;DR:
- Assign each conversion a value before launch, use margin figures from finance, and value micro conversions according to historical progress toward closed sales.
- Use first or last touch for short sales cycles; data driven attribution needs enough conversions, while marketing mix modeling requires historical data and statistical expertise.
- Connect the CRM to analytics, tag campaigns, and test full funnel conversions; audit tracking when reported revenue differs from booked revenue by 10% or more.
- Judge channels by marginal ROMI, not average returns, and run holdout tests before shifting budget because attribution reflects past spending patterns.
- Review campaigns weekly, reconcile tracked revenue with booked revenue monthly, and reassess attribution assumptions quarterly rather than waiting for tracking failures.
Table of Contents
- Quick Summary
- Key Metrics That Make ROI Tracking Meaningful
- Choosing an Attribution Model Without Overcomplicating It
- Setting Up Reliable ROI Tracking Step by Step
- Tools and Integrations That Support a Single Source of Truth
- Privacy, Data Quality, and the Limits of What You Can Measure
- Turning ROI Numbers Into Budget Decisions
- Why Measurable Marketing Still Gets Treated as an Afterthought
- Getting Help Setting Up ROI Tracking That Holds Up
- FAQ
- Sources
Quick Summary
Here’s the shortlist we’d hand a marketing team starting from scratch:
- Define what counts as a conversion before you build any tracking.
- Set UTM parameters and event tags across every campaign touchpoint.
- Connect your CRM to analytics so revenue data isn’t siloed.
- Validate tracking with test conversions before trusting the dashboard.
- Build one dashboard that normalizes CAC, CLV, conversion rate, and ROMI.
- Reconcile reported revenue against actual closed deals monthly.
- Revisit attribution assumptions every quarter, not just when something breaks.
Key Metrics That Make ROI Tracking Meaningful
Return on marketing investment (ROMI) only means something when it’s built on net contribution rather than gross revenue. The American Marketing Association’s guidance on ROMI recommends calculating it as incremental revenue multiplied by gross margin, minus marketing investment, divided by marketing investment. That distinction matters because gross revenue ignores the cost of goods sold, which inflates ROI for low-margin products and understates it for high-margin ones.
A few calculations do most of the work:
- Customer Acquisition Cost (CAC): total marketing and sales spend divided by new customers acquired in that period.
- Customer Lifetime Value (CLV): average order value multiplied by purchase frequency multiplied by average customer lifespan, adjusted for margin.
- Conversion rate: conversions divided by total qualified visitors or leads, tracked separately for micro conversions (email signups, demo requests) and macro conversions (closed sales).
- Incremental revenue: revenue attributable to marketing activity beyond what would have happened without it, often estimated through holdout tests or historical baselines.
Margin assumptions deserve more attention than they usually get. Micro conversions matter because they feed the funnel that eventually produces macro conversions, but they should carry a fraction of the monetary value assigned to a closed sale, scaled to historical conversion rates between stages.
Choosing an Attribution Model Without Overcomplicating It
Attribution models answer a simple question differently: which touchpoint gets credit for a conversion? The model you pick should match your data maturity, not the most sophisticated option available.
- First-touch and last-touch are the easiest to set up and work fine for short sales cycles with one or two channels, but they ignore everything in between.
- Linear and time-decay spread credit across the journey and suit businesses with multiple touchpoints but limited data science resources.
- Data-driven attribution, the model Google Analytics 4 uses by default, allocates credit based on actual path data specific to each property, which requires enough conversion volume to be statistically reliable.
- Marketing-mix modeling (MMM) works at the aggregate level and captures offline and long-term brand effects that touch-based models miss entirely, but it demands more historical data and statistical expertise to run well.
The AMA’s research on multitouch attribution notes that attribution estimates are conditional on how budget was already allocated, so a model trained on last year’s spending mix won’t necessarily predict what happens if you shift dollars somewhere new. That’s why experiments and elasticity analysis matter more than attribution alone when you’re deciding where the next dollar should go.
Pro Tip: Run a simple holdout test (withhold a channel from a subset of markets for a few weeks) before trusting any attribution model’s budget recommendation.
Setting Up Reliable ROI Tracking Step by Step
Reliable ROI numbers come from a process, not a single tool. Here’s the sequence we follow:
- Define objectives and conversions. Decide what counts as a conversion (purchase, lead, demo booking) and assign a monetary value to each, including partial values for micro conversions.
- Choose revenue rules and margin figures. Pull gross margin from finance, not estimates, and agree on how revenue gets attributed when a customer touches multiple channels.
- Instrument tracking. Set UTM parameters consistently across every campaign, implement event tags for key actions, and add server-side tracking where browser-based tags are likely to miss events due to ad blockers or privacy settings.
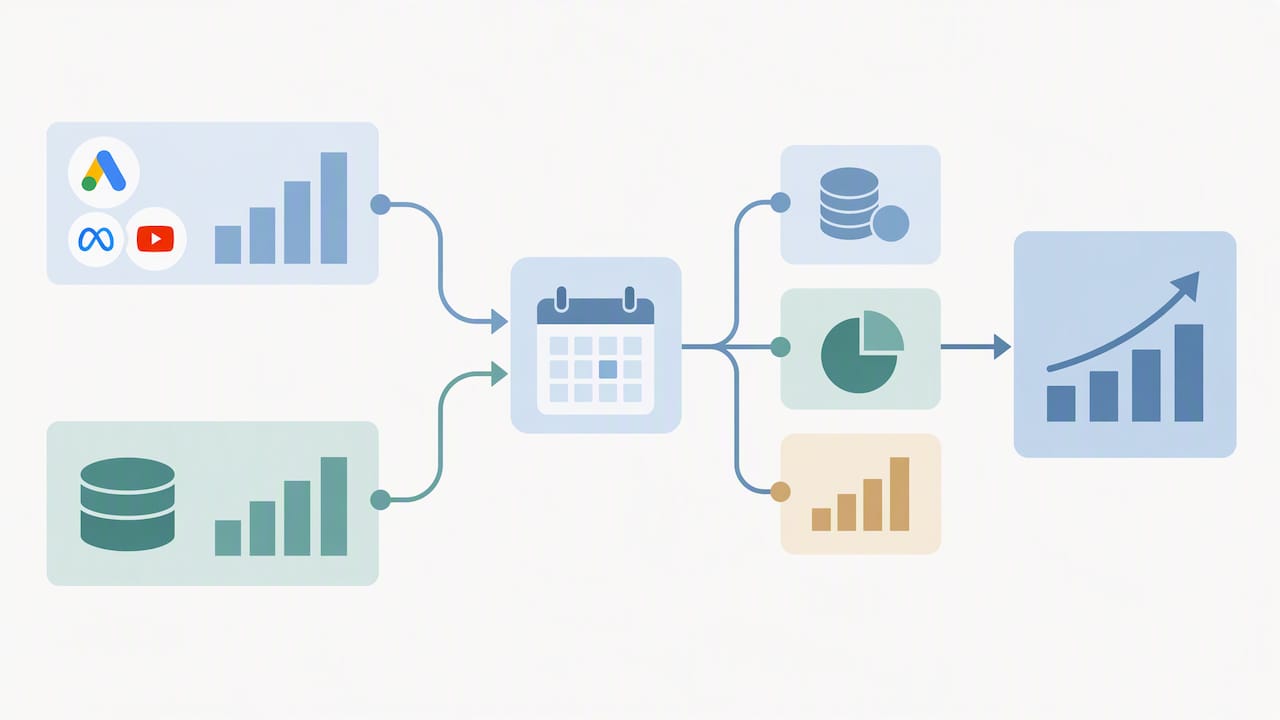
- Connect CRM and attribution tools. Link your CRM to analytics and ad platforms so closed-deal revenue flows back into the same system that tracked the original click or impression.
- Reconcile and validate. Run test conversions through the full funnel and check that what lands in your CRM matches what your analytics platform reports. Build a simple monthly reconciliation report comparing tracked revenue to actual booked revenue.
- Set a reporting cadence. Weekly for tactical campaign adjustments, monthly for budget reviews, quarterly for attribution model reassessment.
Pro Tip: Treat a 10% or greater gap between tracked and actual revenue as a signal to audit your tagging before you make any budget decisions off that number.
Guardrails matter as much as the process itself. Don’t reallocate budget off a single week of data, and don’t trust a channel’s reported ROI until it’s survived at least one reconciliation cycle.
Tools and Integrations That Support a Single Source of Truth
Four categories of tools do most of the work in a functional ROI tracking stack:
- Analytics platforms like GA4 handle event tracking, conversion paths, and model comparison reports.
- CRM systems hold the closed-loop revenue data that analytics platforms can’t see on their own.
- Ad platforms (Google Ads, Meta Ads) report spend and platform-attributed conversions, which need reconciling against your own data.
- CDP and BI tools stitch the above together into normalized dashboards when spreadsheets stop scaling.
The priority order matters more than the tool list. Connect CRM to analytics first, since that’s the link that turns a click into a dollar figure. Then connect ad platforms so spend data flows into the same system automatically rather than getting pulled manually each month. Server-side event tracking deserves attention early too, since browser-based tags increasingly miss conversions due to ad blockers and privacy settings, something we cover in more detail in our ad tracking guide.
A dashboard built on this foundation should normalize metrics to the same time windows, include a visible margin field so ROMI calculations stay transparent, and avoid mixing platform-reported conversions with CRM-verified ones in the same column. For teams running paid search specifically, our Google Ads conversion tracking guide walks through the platform-side setup in more depth.
Privacy, Data Quality, and the Limits of What You Can Measure
Privacy rules and browser restrictions mean fewer events reach you at the individual level than they used to, which pushes measurement toward modeled and aggregated data instead of pure user-level tracking. NIST’s guidance on data analytics and privacy risk recommends that businesses using data analytics review their service providers and consider privacy-enhancing technologies (PETs) as part of managing that risk, with NIST’s Privacy Framework as a starting reference point.
Even strong tracking setups carry a data-quality gap, and the NIST privacy risk guidance frames this as a structural issue in analytics, not a configuration mistake you can fully eliminate.
A short checklist keeps data quality from drifting:
- Deduplicate conversions across platforms before they hit your dashboard.
- Use consistent customer identifiers across CRM, analytics, and ad platforms.
- Align reporting time windows so a 7-day attribution window isn’t compared against a 30-day one.
- Reconcile tracked revenue against finance’s actual booked revenue every month.
Turning ROI Numbers Into Budget Decisions
A single ROMI figure tells you less than you’d think. Marginal ROMI, the return on the next dollar spent rather than the average return across all spend, is the number that actually guides budget decisions, since it reveals where a channel is hitting diminishing returns before the aggregate number shows any sign of trouble. Elasticity analysis, which measures how much incremental revenue changes per additional dollar of spend, fills the gap when you need to model a bigger shift than historical data covers.
Prioritize reallocation decisions with evidence, not instinct:
- Run holdout tests before moving a meaningful chunk of budget between channels.
- Treat attribution-model output as a hypothesis to test, not a verdict to act on immediately.
- Reserve larger budget shifts for channels where marginal ROMI has been declining for more than one reporting cycle.
An executive-ready report doesn’t need every metric in this article. A headline ROMI number, the two or three channels driving most of the result, and one recommended action cover what a leadership team needs to approve a budget change. Our guide to dashboard metrics that drive decisions goes deeper into structuring that kind of report.
Why Measurable Marketing Still Gets Treated as an Afterthought
Most marketing teams can tell you what they spent. Far fewer can tell you what it returned, and that gap usually isn’t a tooling problem. It’s a sequencing one: campaigns launch before conversions are defined, tags get added after the fact, and by the time someone asks for an ROI number, three months of data are already unreliable.
We built our measurement work around fixing that sequencing problem rather than adding another dashboard on top of messy data. Conversion tracking gets wired in at launch instead of retrofitted later, which is where most ROI gaps start in the first place. Clients typically get a clearer read on which channels are actually earning their budget, not just which ones are easiest to report on.
— PHENYX
Getting Help Setting Up ROI Tracking That Holds Up
If the checklist above feels like more setup work than your team has time for, that’s exactly the gap our measurement work closes. We handle the wiring, conversion tagging, CRM integration, and dashboard build so the ROMI number you report actually reflects what happened, not what a half-connected tracking stack guessed at.
Our MODS plan bundles this measurement setup with ongoing website, SEO, and paid ads support under one in-house team, starting at several thousand dollars per month. A discovery call typically starts with a quick audit of what’s currently tracked and where the gaps are, similar to the process outlined in our marketing audit checklist, so you know exactly what’s missing before committing to anything.
FAQ
What is the 70/20/10 rule in marketing?
The 70/20/10 rule is a budget allocation guideline: 70% of marketing spend goes to proven channels and tactics, 20% to promising newer approaches, and 10% to experimental ideas with uncertain returns. It’s a planning heuristic rather than a measurement method, so it works alongside ROI tracking rather than replacing it.
What is a good ROI for marketing?
There’s no single universal benchmark, since a good ROMI depends heavily on industry margin, sales cycle length, and how a business defines incremental revenue. Rather than chasing an external benchmark, compare a campaign’s marginal ROMI against your own historical performance and other channels in the same budget period.
What is the 40-40-20 rule in marketing?
Like the 70/20/10 rule, it’s a planning framework for where to focus effort, not a formula tied to measured ROI data.
How do I calculate marketing ROI?
Calculate marketing ROI by taking incremental revenue attributable to a campaign, multiplying it by gross margin, subtracting total marketing cost, and dividing that result by the marketing cost, a formula the AMA outlines as net marketing contribution. Getting an accurate number depends on defining incremental revenue carefully, since it should reflect what wouldn’t have happened without the marketing activity, not total revenue in the period.
Can PHENYX help with marketing ROI tracking specifically?
Yes, our measurement work covers conversion tracking setup, CRM integration, and dashboard reporting as part of broader website, SEO, and paid ads engagements. It’s available as part of MODS or as a component of individual service engagements, depending on what a business already has in place.
Sources
- Using Return on Marketing Investment Effectively
- Attribution in Google Analytics
- Data analytics for small businesses: how to manage privacy risks